
You take care of patients, send claims, and mail statements. The big question is how long it takes for that money to show up in your bank account. If you run a clinic in the United States, slow payments can squeeze everything. It can make payroll stressful, delay supply orders, and stall plans to grow or improve care.
That is why it helps to track AR Days. AR Days, also called Days in Accounts Receivable, tells you the average number of days it takes to get paid after you post a charge. In other words, it measures how fast your work turns into cash.
In this guide, we will walk through simple steps to calculate your AR Days, what the number means, and how to use it to make better day to day decisions.
How to Calculate AR Days in Medical Billing?
Let’s go through how to calculate AR Days step by step and more importantly, how to understand what that number really tells you and how you can use it to improve your revenue cycle.
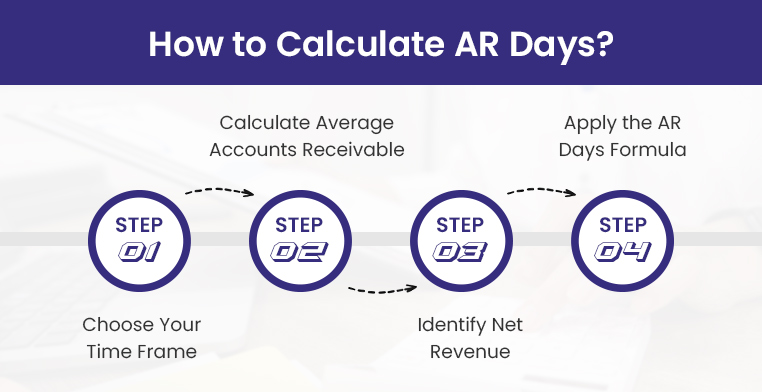
Step 1: Pick Your Time Frame
First, decide the period you want to look at. This choice sets the stage for the whole calculation.
Most practices stick with one of these:
- Monthly (30 days): Helpful if you want a quick checkup on how billing is moving.
- Quarterly (90 days): Useful for spotting trends or seasonal changes.
- Yearly (365 days): Best when you want the big picture of how your billing system is working over time.
★ Note:
Use the same window each time. If you pick monthly, keep using monthly. If you pick quarterly, keep using quarterly. AR Days uses the number of days in your window as part of the math. When you change the window, you change the math, so the result can shift even if your billing did not really change.
Quick example:
Say your ending AR is 150,000.
➜ If you use one month with 30 days and that month had 90,000 in charges, your average daily charges are 3,000. AR Days is 150,000 divided by 3,000, which is 50 days.
➜ If you switch to a quarter with 90 days and that quarter had 240,000 in charges, your average daily charges are 2,667. AR Days becomes 150,000 divided by 2,667, which is about 56 days.
So here you see, that nothing about your AR balance changed. Only the window changed, and the number moved. That is why you want to compare month to month, or quarter to quarter, but not mix them. If you ever switch, redo your older numbers so they all use the same window.
Step 2: Calculate Your Average AR
This step tells you, on a typical day in your chosen window, how much money was still waiting to be collected.
You need two numbers from your billing system or AR aging report:
- Beginning AR balance: What was unpaid on the first day of the period. Count both insurance and patient portions. Leave out credit balances and unapplied prepayments so the number is not skewed.
- Ending AR balance: What was unpaid on the last day of the period, using the same rules.
Formula:
Average AR = (Beginning AR + Ending AR) ÷ 2
Example:
- Beginning AR = 100,000
- Ending AR = 160,000
- Average AR = (100,000 + 160,000) ÷ 2 = 130,000
That 130,000 is the average amount sitting in your system, waiting to be collected. If this number keeps climbing, it can point to slow follow up, denials that are not worked, missing documentation, or statements that are not getting paid.
Step 3: Find Your Net Patient Revenue
Now figure out how much revenue you earned from patient care during the same window you picked in Step 1. Use what you earned for services in that period, not the cash that happened to come in.
In most systems this is called net charges, net production, or net patient service revenue.
What to include
- Charges for visits and procedures in that time frame
- Both the insurance and patient portions
- After your usual payer discounts and fee schedule adjustments
What to leave out
- Cash deposits and payments collected this period for older claims
- Non patient income like rent, grants, or product sales that do not run through AR
- Credit balances, prepayments, and refunds
Simple way to get it
- Start with gross charges for the period
- Subtract contractual adjustments and routine discounts
- The result is your net patient revenue for that window
Example:
- Gross charges Jan to Mar: 600,000
- Contractual adjustments and discounts: 120,000
- Net patient revenue: 480,000
This number is the best match for AR because AR tracks what you are owed from services you provided. Using cash collections can throw things off, since some of that cash pays old claims and some of your new claims have not been paid yet. You will turn this into a per day number in the next step.
Step 4: Calculate AR Days
Now plug in your numbers. Use the same window you picked in Step 1.
Formula: AR Days = (Average AR ÷ Net Revenue) × Number of days in your window
With our example:
➜ Average AR = 130,000
➜ Net Revenue = 480,000
➜ Time frame = 90 days
AR Days = (130,000 ÷ 480,000) × 90 = 24.375
Round it the way you prefer. Most practices use whole days, so about 24 days.
What it means:
That is your typical wait time to collect after you post a charge. Lower is better because it means cash is moving. If the number climbs, look for slow follow up, denials that are not worked, or patient bills that are confusing.
Understanding AR Days Benchmarks – What Your Number Really Means?
Once you have calculated your AR Days, the next step is to interpret what the figure indicates about your billing performance. Below is a general framework for evaluating AR Days in a healthcare setting:
🟢 Less than 30 Days
This is an excellent range. It suggests that claims are being paid promptly and that follow-up processes are efficient. For most practices, this is considered the optimal benchmark.
🟡 30 to 40 Days
This range is generally acceptable, but it indicates that there is room for improvement. Delays may be occurring due to slower patient payments, minor issues with claim processing, or inconsistent follow-up on outstanding balances.
🔴 More than 40 Days
This should be regarded as a warning sign. Extended AR Days indicate that payments are being delayed, which can negatively impact cash flow. At this point, it is advisable to review the billing process closely to identify bottlenecks such as untimely claim submissions, lack of denial management service, or barriers in patient collections.
Common Mistakes in AR Days Calculation And How to Avoid Them
Even experienced billing teams can miscalculate AR Days if they’re not careful with the data. Here are four of the most frequent mistakes we see and how to fix them:
Mistake 1: Using Gross Charges Instead of Net Revenue
A common error is plugging gross charges into the formula instead of net revenue. Gross charges are the full amounts you bill, but they include fee schedules, adjustments, and write-offs that you will never actually collect. If you use those inflated numbers, your AR Days calculation will look worse than reality.
The fix is simple. Always use net revenue, which reflects the money you realistically expect to collect after adjustments. That way, your AR Days show how long it truly takes to get paid.
Mistake 2: Ignoring Seasonal Fluctuations
Looking at just one month or quarter without context can be misleading. Some months naturally run slower, such as December when patients delay care, or January when deductibles reset. If you do not account for these patterns, your AR Days might look bad when in fact it is just the calendar at play.
A better approach is to compare AR Days across several periods and review year-over-year trends. This helps you tell the difference between a true billing issue and a seasonal dip.
Mistake 3: Treating All Payers the Same
When you calculate AR Days as one big number, you lose sight of how individual payers behave. For example, Medicare may pay in about two weeks, while some commercial plans take a month or more. Lumping them together hides the slow payers.
To get a clearer picture, break down AR Days by payer. This way, you can see exactly which insurers are dragging their feet and focus your follow-ups where they matter most.
Mistake 4: Mixing Patient Balances with Insurance AR
Another trap is combining patient responsibility and insurance receivables into one total. Patients often take longer to pay, especially if statements are confusing or payment options are limited. If you mix patient AR with insurance AR, you will not know whether the slowdown is coming from payers or patients.
The solution is to track them separately. By keeping insurance AR and patient AR apart, you can tell where the holdup starts and adjust your collection efforts accordingly.
Cut AR Days and Increase Collections with BellMedEx
Whether you’re a solo provider, multi-specialty group, or urgent care network, BellMedEx gives you the tools, insights, and support to reduce AR Days and improve collections without adding more work to your team.
| Metric | Before BellMedEx | After BellMedEx |
| AR Days | 45–60 Days | 22–30 Days |
| Denial Rate | 12–18% | < 5% |
| Patient AR Over 90 Days | 35%+ | < 15% |
| Revenue Growth | Flat or declining | +15–30% YoY |
Ready to see how much faster you could be collecting? Let’s run a free AR Days audit and show you exactly where your revenue cycle can improve.