Medicare reimbursement rates for mental health therapy will decrease by approximately 14% in 2025 compared to 2024, varying by state. Rural areas are taking the biggest hit in the new year.
While Alaska and parts of California still pay more than other states, they’ll also see smaller decreases. Big cities like Chicago, Miami, and Houston, which typically have higher payment rates, will also face Medicare cuts in 2025 of more than 16%.
Before we jump on the table for details by state, let us quickly share some factors affecting Medicare payment for mental health therapy in 2025.
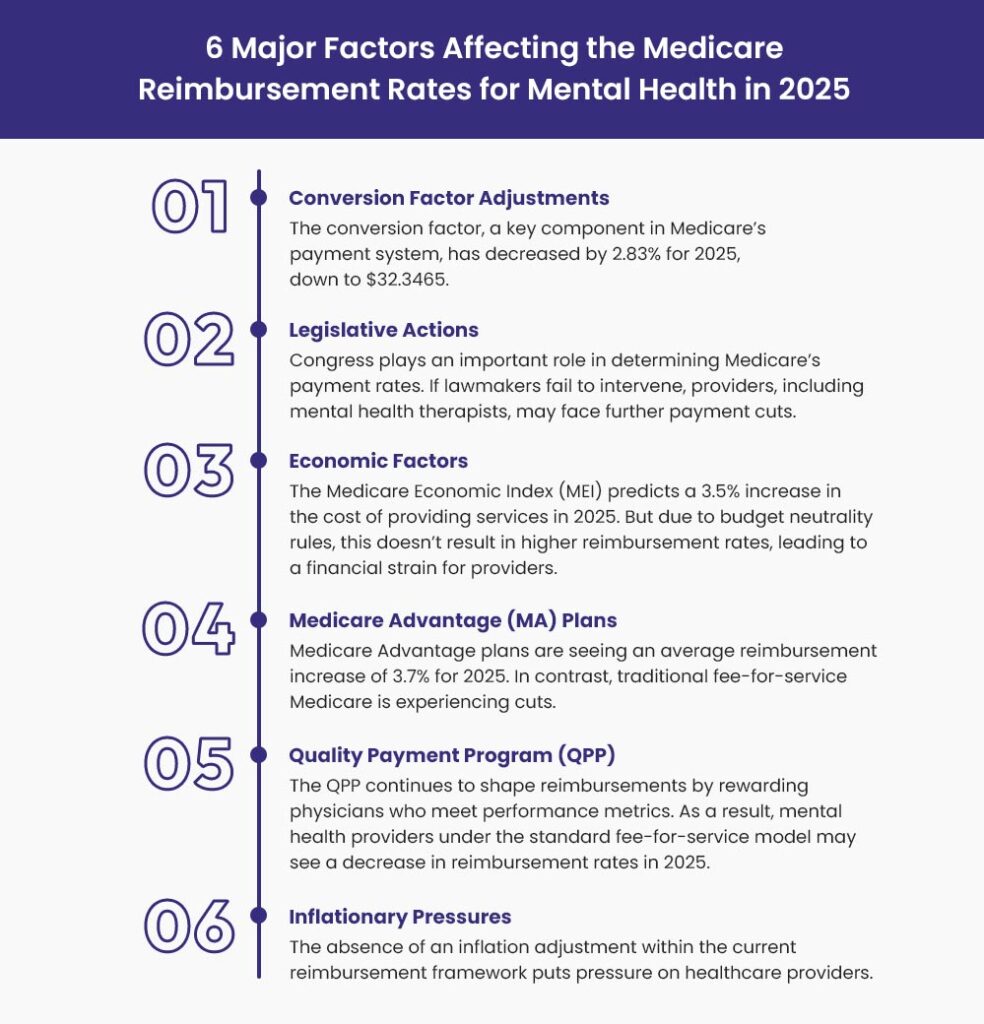
Factors Influencing the Medicare Reimbursement Rates for MHT in 2025

Medicare reimbursement rates for mental health therapy services in 2025 are shaped by a variety of factors, from legislative actions to economic conditions.
Here are the key elements influencing these rates:
- Conversion Factor Adjustments
- Legislative Actions
- Economic Factors
- Medicare Advantage (MA) Plans
- Quality Payment Program (QPP)
- Inflationary Pressures
- Other factors
Let’s have a quick look at these factors now.
1. Conversion Factor Adjustments
The conversion factor, a key component in Medicare’s payment system, has decreased by 2.83% for 2025, down to $32.3465. This marks the fifth consecutive year of reductions. The decrease is due to the expiration of a temporary adjustment and a 0% baseline update, which does not account for inflation in practice costs.
2. Legislative Actions
Congress plays an important role in determining Medicare’s payment rates. If lawmakers fail to intervene, providers, including mental health therapists, may face further payment cuts. Legislative action helps stabilize and increase reimbursement rates for mental health services.
3. Economic Factors
The Medicare Economic Index (MEI) predicts a 3.5% increase in the cost of providing services in 2025. However, due to budget neutrality rules, this increase does not result in higher reimbursement rates, leading to a financial strain for providers.
4. Medicare Advantage (MA) Plans
Medicare Advantage plans are seeing an average reimbursement increase of 3.7% for 2025. In contrast, traditional fee-for-service Medicare is experiencing cuts. This difference underscores a growing trend toward shifting reimbursements from traditional Medicare to MA plans.
5. Quality Payment Program (QPP)
The QPP continues to shape reimbursements by rewarding physicians who meet performance metrics. Those involved in Advanced Alternative Payment Models (APMs) may see higher payments compared to providers under the standard fee-for-service model. This shows a shift toward value-based care in 2025.
6. Inflationary Pressures
The absence of an inflation adjustment within the current reimbursement framework puts pressure on healthcare providers. Consequently, as costs rise, many mental health therapy practices face financial challenges in delivering care.
7. Other Factors (Not Entirely Applicable in 2025)
Geographic reimbursement variations, impact of fee schedule area, differences in CPT codes can affect reimbursements. But mental health therapy reimbursement rates will drop in 2025 mainly because of new laws, economic challenges, and the reasons mentioned earlier.
Medicare Reimbursement Rates for Mental Health Therapy by State and Areas in 2025
The table outlines the reimbursement rates for CPT Code 90791 (Mental Health Therapy) across various states and counties in the US. It shows the percentage change in reimbursement rates for 2024 and 2025.

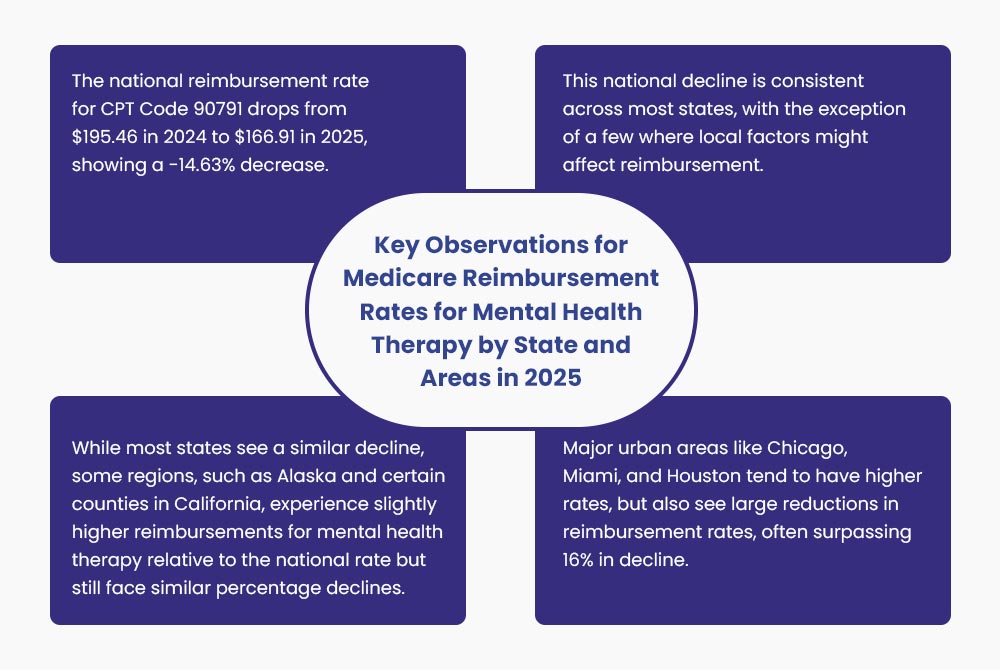
But first, let us share the key observations across states:
- The national reimbursement rate for CPT Code 90791 drops from $195.46 in 2024 to $166.91 in 2025, showing a -14.63% decrease.
- This national decline is consistent across most states, with the exception of a few where local factors might affect reimbursement.
- While most states see a similar decline, some regions, such as Alaska and certain counties in California, experience slightly higher reimbursements for mental health therapy relative to the national rate but still face similar percentage declines.
- Major urban areas like Chicago, Miami, and Houston tend to have higher rates, but also see large reductions in reimbursement rates, often surpassing 16% in decline.
Jump on the table below for more details by state:
| State | Fee Schedule Area | Reimbursement VS National Rate | CPT Code 90791 Reimbursement Rate | Percentage Change | |
| 2024 | 2025 | ||||
| NATIONAL | National | 100.00% | $195.46 | $166.91 | -14.63% |
| California | Santa Clara (Santa Clara County) | 115.38% | $224.26 | $192.58 | -14.12% |
| California | San Jose-Sunnyvale-Santa Clara (San Benito County) | N/A | $225.09 | N/A | N/A |
| California | San Francisco (San Francisco County) | N/A | $219.23 | N/A | N/A |
| California | San Mateo (San Mateo County) | 116.60% | $219.23 | $194.62 | -11.23% |
| California | Oakland-Berkeley (Alameda and Contra Costa) | 110.72% | $219.23 | $184.80 | -15.68% |
| California | San Francisco-Oakland-Hayward (Marin County) | 115.43% | $219.44 | $192.66 | -12.18% |
| California | Salinas (Monterey County) | 110.62% | $209.01 | $184.63 | -11.65% |
| California | Napa | 102.81% | $209.67 | $171.60 | -18.15% |
| California | Vallejo-Fairfield (Solano County) | 102.38% | $209.67 | $170.89 | -18.50% |
| California | Santa Cruz-Watsonville | 102.38% | $209.55 | $170.89 | -18.43% |
| California | Santa Rosa (Sonoma County) | 102.38% | $208.27 | $170.89 | -17.93% |
| California | Riverside-San Bernardino-Ontario (San Bernardino and Riverside County) | 102.38% | $202.15 | $170.89 | -15.45% |
| California | Bakersfield (Kern County) | 102.38% | $202.42 | $170.89 | -15.55% |
| California | Sacramento-Roseville-Arden-Arcade (Sacramento, Placer, Yolo, El Dorado) | 102.38% | $202.86 | $170.89 | -15.75% |
| California | Chico (Butte County) | 102.38% | $200.53 | $170.89 | -14.79% |
| California | Fresno | 103.03% | $200.53 | $171.97 | -14.23% |
| California | Hanford-Corcoran (Kings County) | 105.36% | $200.53 | $175.86 | -12.30% |
| California | Madera | 105.65% | $200.53 | $176.34 | -12.07% |
| California | Merced | 116.87% | $200.53 | $195.07 | -2.72% |
| California | Modesto (Stanislaus County) | 105.35% | $200.53 | $175.84 | -12.32% |
| California | Redding (Shasta County) | 106.64% | $200.53 | $177.99 | -11.24% |
| California | Stockton-Lodi (San Joaquin County) | 102.38% | $200.53 | $170.89 | -14.79% |
| California | Visalia-Porterville (Tulare County) | 102.38% | $200.53 | $170.89 | -14.79% |
| California | Yuba City (Sutter, Yuba) | 102.38% | $200.53 | $170.89 | -14.79% |
| California | California (All Other Counties) | 102.38% | $200.53 | $170.89 | -14.79% |
| California | Los Angeles-Long Beach-Anaheim (Los Angeles County) | 105.58% | $209.34 | $176.23 | -15.81% |
| California | Long Beach-Anaheim (Orange County) | 107.11% | $209.34 | $178.78 | -14.59% |
| California | Oxnard-Thousand Oaks-Ventura | N/A | $206.33 | N/A | N/A |
| California | Santa Maria-Santa Barbara | 102.41% | $207.59 | $170.93 | -17.65% |
| California | San Diego-Carlsbad | 105.77% | $206.43 | $176.54 | -14.48% |
| California | San Luis Obispo-Paso Robles-Arroyo Grande | 103.31% | $201.63 | $172.43 | -14.49% |
| California | El Centro (Imperial County) | 104.92% | $200.63 | $175.12 | -12.70% |
| California | Hawaii, Guam, American Samoa, Marshall Islands, Palau, Northern Mariana Islands, FSM | 102.67% | $201.98 | $171.37 | -15.14% |
| Nevada | Statewide | 99.69% | $197.78 | $166.40 | -15.87% |
| Alaska | Statewide | 138.33% | $271.70 | $230.89 | -15.02% |
| Idaho | Statewide | 96.78% | $187.19 | $161.53 | -13.71% |
| Oregon | Portland (Clackamas, Multnomah, and Washington) | 102.80% | $199.43 | $171.58 | -14.0% |
| Oregon | Rest of State | 98.98% | $190.93 | $165.20 | -13.5% |
| Washington | WASHINGTON SEATTLE (KING COUNTY) | 108.12% | $208.55 | $180.46 | -13.5% |
| Washington | REST OF STATE | 101.08% | $194.94 | $168.72 | -13.4% |
| Arizona | STATEWIDE | 99.13% | $192.57 | $165.45 | -14.1% |
| Montana | STATEWIDE | 99.96% | $195.36 | $166.84 | -14.6% |
| North Dakota | STATEWIDE | 99.07% | $192.88 | $165.35 | -14.3% |
| South Dakota | STATEWIDE | 98.80% | $192.50 | $164.91 | -14.3% |
| Utah | STATEWIDE | 98.28% | $190.85 | $164.04 | -14.1% |
| Wyoming | STATEWIDE | 99.49% | $194.74 | $166.06 | -14.7% |
| Colorado | STATEWIDE | 101.51% | $196.70 | $169.43 | -13.8% |
| New Mexico | STATEWIDE | 98.15% | $191.46 | $163.83 | -14.4% |
| Oklahoma | STATEWIDE | 97.06% | $189.03 | $162.00 | -14.3% |
| Texas | HOUSTON | 100.78% | $200.98 | $168.22 | -16.3% |
| Texas | GALVESTON (TARRANT COUNTY) | 100.74% | $199.26 | $168.15 | -15.6% |
| Texas | BRAZORIA | 100.76% | $199.12 | $168.18 | -15.6% |
| Texas | DALLAS | 101.91% | $197.93 | $170.09 | -14.0% |
| Texas | FORT WORTH (TARRANT COUNTY) | 97.60% | $195.47 | $162.91 | -16.7% |
| Texas | AUSTIN (TRAVIS COUNTY) | 100.58% | $196.07 | $167.88 | -14.5% |
| Texas | REST OF STATE | 100.92% | $191.52 | $168.45 | -12.0% |
| Texas | BEAUMONT (JEFFERSON COUNTY) | 98.57% | $190.86 | $164.52 | -13.8% |
| Iowa | STATEWIDE | 96.89% | $188.60 | $161.72 | -14.3% |
| Kansas | STATEWIDe | 96.88% | $188.80 | $161.71 | -14.3% |
| Missouri | METROPOLITAN ST. LOUIS (JEFFERSON, ST. CHARLES, ST. LOUIS AND ST. LOUIS CITY) | 98.85% | $193.86 | $164.99 | -14.9% |
| Missouri | METROPOLITAN KANSAS CITY (CLAY, JACKSON AND PLATTE) | 98.75% | $192.91 | $164.83 | -14.6% |
| Missouri | REST OF STATE | 96.61% | $187.91 | $161.26 | -14.2% |
| Nebraska | STATEWIDE | 96.69% | $187.78 | $161.38 | -14.1% |
| Illinois | CHICAGO (COOK COUNTY) | 99.58% | $203.03 | $166.21 | -18.2% |
| Illinois | SUBURBAN CHICAGO (DUPAGE, KANE, LAKE AND WILL) | 102.73% | $201.46 | $171.47 | -14.9% |
| Illinois | EAST ST. LOUIS (BOND, CALHOUN, CLINTON, JERSEY, MACOUPIN, MADISON, MONROE, MONTGOMERY, RANDOLPH, ST. CLAIR AND WASHINGTON) | 103.04% | $195.81 | $171.98 | -12.2% |
| Illinois | Rest of the State | 98.66% | $192.26 | $164.67 | -14.3% |
| Minnesota | Statewide | 99.23% | $193.12 | $165.63 | -14.3% |
| Wisconsin | Statewide | 97.69% | $189.62 | $163.05 | -14.0% |
| Arkansas | Statewide | 95.75% | $186.04 | $159.82 | -14.1% |
| Louisiana | NEW ORLEANS (JEFFERSON, ORLEANS, PLAQUEMINES AND ST. BERNARD) | 98.77% | $194.52 | $164.85 | -15.3% |
| Louisiana | REST OF STATE | 97.15% | $191.00 | $162.15 | -15.1% |
| Mississippi | STATEWIDE | 96.05% | $186.74 | $160.32 | -14.1% |
| Indiana | STATEWIDE | 97.15% | $188.46 | $162.16 | -14.0% |
| Michigan | DETROIT (MACOMB, OAKLAND, WASHTENAW AND WAYNE) | 101.28% | $198.15 | $169.05 | -14.7% |
| Michigan | REST OF STATE | 98.23% | $191.30 | $163.96 | -14.3% |
| Florida | MIAMI (DADE AND MONROE COUNTY) | 101.44% | $203.91 | $169.32 | -16.9% |
| Florida | FORT LAUDERDALE (BROWARD, COLLIER, INDIAN RIVER, LEE, MARTIN, PALM BEACH, AND ST. LUCIE) | 103.55% | $199.41 | $172.83 | -13.4% |
| Florida | REST OF STATE | 99.48% | $194.65 | $166.05 | -14.7% |
| Puerto Rico | PUERTO RICO | 100.13% | $195.77 | $167.13 | -14.7% |
| Virgin Islands | VIRGIN ISLANDS | 100.13% | $195.77 | $167.13 | -14.7% |
| Alabama | STATEWIDE | 96.08% | $189.98 | $160.36 | -15.7% |
| Georgia | ATLANTA (BUTTS, CHEROKEE, CLAYTON, COBB, DEKALB, DOUGLAS, FAYETTE, FORSYTH, FULTON, GWINNETT, NEWTON, ROCKDALE AND WALTON) | 100.17% | $194.94 | $167.20 | -14.3% |
| Georgia | REST OF STATE | 97.48% | $189.45 | $162.70 | -14.1% |
| Tennessee | STATEWIDE | 96.66% | $188.22 | $161.33 | -14.3% |
| South Carolina | STATEWIDE | 97.59% | $189.64 | $162.88 | -14.1% |
| Virginia | STATEWIDE | 99.29% | $194.77 | $165.73 | -14.9% |
| West Virginia | STATEWIDE | 97.38% | $189.87 | $162.54 | -14.4% |
| North Carolina | STATEWIDE | 97.60% | $191.35 | $162.90 | -14.9% |
| Delaware | STATEWIDE | 100.38% | $196.87 | $167.55 | -14.9% |
| Washington, DC | DC + MD/VA SUBURBS (DISTRICT OF COLUMBIA; ALEXANDRIA CITY, ARLINGTON, FAIRFAX, FAIRFAX CITY, FALLS CHURCH CITY IN VIRGINIA; MONTGOMERY AND PRINCE GEORGE’S IN MARYLAND) | 109.11% | $215.43 | $182.11 | -15.5% |
| Maryland | BALTIMORE/SURROUNDING COUNTIES | 103.93% | $205.34 | $173.47 | -15.5% |
| Maryland | REST OF STATE | 101.22% | $199.07 | $168.94 | -15.1% |
| New Jersey | NORTHERN NEW JERSEY (BERGEN, ESSEX, HUDSON, HUNTERDON, MIDDLESEX, MORRIS, PASSAIC, SOMERSET, SUSSEX, UNION AND WARREN) | 108.89% | $211.50 | $181.75 | -14.1% |
| New Jersey | REST OF STATE | 105.76% | $207.10 | $176.53 | -14.8% |
| Pennsylvania | METROPOLITAN PHILADELPHIA (BUCKS, CHESTER, DELAWARE, MONTGOMERY AND PHILADELPHIA) | 103.38% | $203.36 | $172.55 | -15.2% |
| Pennsylvania | REST OF STATE | 98.12% | $192.17 | $163.78 | -14.8% |
| Connecticut | STATEWIDE | 104.19% | $205.75 | $173.90 | -15.5% |
| New York | NYC SUBURBS/LONG ISLAND (BRONX, KINGS, NASSAU, RICHMOND, ROCKLAND, SUFFOLK AND WESTCHESTER) | 110.03% | $220.07 | $183.65 | -16.5% |
| New York | MANHATTAN | 111.33% | $217.56 | $185.82 | -14.6% |
| New York | POUGHKPSIE/N NYC SUBURBS (COLUMBIA, DELAWARE, DUTCHESS, GREENE, ORANGE, PUTNAM, SULLIVAN AND ULSTER) | 106.45% | $207.12 | $177.67 | -14.2% |
| New York | REST OF STATE | 98.27% | $192.28 | $164.03 | -14.7% |
| New York | QUEENS | 110.34% | $221.56 | $184.17 | -16.9% |
| Maine | SOUTHERN MAINE (CUMBERLAND AND YORK COUNTY) | 99.62% | $193.75 | $166.27 | -14.2% |
| Maine | REST OF STATE | 97.26% | $189.22 | $162.34 | -14.2% |
| Massachusetts | METROPOLITAN BOSTON (MIDDLESEX, NORFOLK AND SUFFOLK) | 107.58% | $211.15 | $179.56 | -14.9% |
| Massachusetts | REST OF STATE | 102.31% | $201.31 | $170.77 | -15.2% |
| New Hampshire | STATEWIDE | 100.61% | $196.83 | $167.92 | -14.7% |
| Rhode Island | STATEWIDE | 102.49% | $200.62 | $171.06 | -14.8% |
| Vermont | STATEWIDE | 98.90% | $193.55 | $165.07 | -14.8% |
| Kentucky | STATEWIDE | 96.92% | $188.69 | $161.77 | -14.3% |
| Ohio | STATEWIDE | 97.96% | $191.91 | $163.50 | -14.8% |

Mental health therapy payment rates are dropping across the US from 2024 to 2025. This could be happening because of budget cuts, new healthcare rules, or rising costs of mental health care. While some areas still pay more than others, payments are going down almost everywhere in the country.
Schedule FREE Consultation to Get Paid More
Dealing with lower insurance payments can be tough for mental health providers. BellMedEx helps therapists get paid more and on time with improved medical billing and revenue cycle management. Get in touch with us today to learn how we can help your practice succeed.


