
The revenue Cycle is the key element to manage and track for any healthcare practice. RCM process starts from patient registration to claim submission. The process involves various complex steps for healthcare providers to complete a successful billing process. There are several Key Performance Indicators (KPIs) in the Revenue Cycle Management process. It is essential for practices to keep a track record of all operations in RCM using these KPIs. This article will explore the top 10 KPIs to track in your revenue cycle management to help you optimize your financial outcomes and improve your practice’s bottom line.
Why You Should Monitor RCM KPIs?
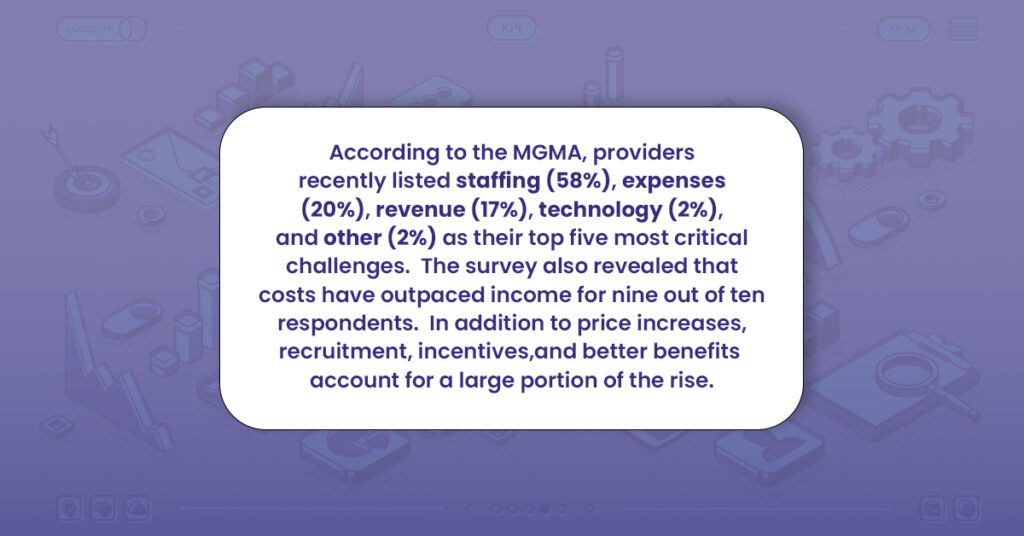
Because of different circumstances, such as price increases and resource usage, financial demands on practices have become even more difficult, so providers need to pay special attention to metrics most closely related to revenue performance.
Here’s why you should monitor RCM KPIs:
• Determine whether the revenue earned (and handled) is sufficient to maintain the viability of your medical practice. If you’re having trouble making ends meet, you must choose wisely if you want to stay in the business for a long time.
• Identify any operational waste that is costing the hospital or clinic money.
• Projections for the future: Do you need more money to expand the ER’s capacity or to purchase specialized equipment to help doctors deliver healthcare?
• Boost patient happiness because any extra funds can be used to give customers a pleasant experience.
Top 10 RCM KPIs You Must Track
| KPI | Description | Formula |
| 1. Account Receivable Days | Tracks how long it takes medical facilities to receive payment from insurance companies. Lower values indicate good cash flow. Formula: (Total accounts receivable / Average daily revenue) | Days in accounts receivable = (Total accounts receivable / Average daily revenue) |
| 2. Accounts Receivable Rate | Gauges the aging of unpaid claims considering different periods. Formula: (Outstanding claims in a timeframe / Total outstanding claims) * 100% | Aged accounts receivable rate = (Outstanding claims in a timeframe / Total outstanding claims) * 100% |
| 3. Clean Claim Rate | Measures how often claims are “clean” with no errors, rejections, and all necessary information. Formula: (Number of clean claims / Total number of claims) * 100% | Clean claims rate = (Number of clean claims / Total number of claims) * 100% |
| 4. Claim Denial Rate | Estimates the number of claims denied by insurance providers. Formula: (Number of denied claims / Total number of claims) * 100% | Claim denial rate = (Number of denied claims / Total number of claims) * 100% |
| 5. Claim Appeal Rate | Monitors the rejected claims that may be appealed to overturn the ruling. Formula: (Number of claims appealed / Total number of denied claims) * 100% | Claim appeal rate = (Number of claims appealed / Total number of denied claims) * 100% |
| 6. Bad Debt Rate | Calculates the proportion of receivables that are past due and uncollectible. Formula: (Total write-offs / Total accounts receivable) * 100% | Bad debt rate = (Total write-offs / Total accounts receivable) * 100% |
| 7. Net Collection Rate | Gauges the amount of money raised relative to the total permitted amount. Formula: (Total payments received / Total allowed amount) * 100% | Net collection rate = (Total payments received / Total allowed amount) * 100% |
| 8. Charge Lag | Identifies any charging delays after medical treatment is rendered. Formula: Date of charges billed – Date of service | Charge lag = Date of charges billed – Date of service |
| 9. Cost to Collect | Determines how much it costs to get paid for services. Formula: Total costs / Total payment collected | Cost to Collect = Total costs / Total payment collected |
| 10. Per-Patient Visit Revenue | Records average earnings from each patient visit. Formula: Total revenue generated per patient visit / Total number of patients | Revenue per patient = Total revenue generated per patient visit / Total number of patients |
The key performance indicators for the healthcare revenue cycle can be as broad and narrow as you’d like them to be. However, tracking these RCM KPIs would be best to get a holistic overview of your revenue cycle.
Providers should consider the top 10 key performance indicators (KPIs).
Account Receivable Days
This indicator tracks how long it typically takes medical facilities to receive payment from insurance companies. You will prefer this number to be lower because that indicates a good cash flow. It shows a healthy cash flow, and you will choose it to be shorter.
It can be challenging to manage cashflows and cover future expenses if you must wait for payments for 50 days or longer. Stricter payment schedules should be put in place to limit account receivable days. Additionally, you could wish to encourage early payments by providing incentives.
Formula to Calculate A/R Days
You can use this formula to check the number of days in accounts receivable.
Days in accounts receivable = (Total accounts receivable / Average daily revenue)
Accounts Receivable Rate
The aged accounts receivable rate, which gauges the aging of unpaid claims, is a comparable metric you may monitor.
It differs from the days in accounts receivable rate since it considers several periods for unpaid claims, often 0 to 30 days, 31 to 60 days, 61 to 90 days, and over 90 days.
This measure can be quickly examined to determine how long claims go without payment before being settled. If resolving outstanding claims takes over 90 days, you should adjust your plan to ensure you get paid in the first cohort of 0–30 days.
A/R Rate Calculation Formula
See the formula below for your medical practice’s aged accounts receivable rate.
Aged accounts receivable rate = (Outstanding claims in a timeframe / Total outstanding claims) * 100%.
Clean Claim Rate
This revenue cycle KPI measures how often claims are “clean,” as the name would imply. In other words, they have never been rejected, include no errors, and have all the necessary information.
A more excellent clean claim ratio indicates that your administrative and billing activities are successful. On the other hand, a smaller figure shows that your processes are inefficient and may be a factor in unsuccessful reimbursements if strategic changes are not funded.
Clean Claim Rate Formula:
Below is the formula to Calculate the clean claim ratio:
Clean claims rate = (Number of clean claims / Total number of claims) * 100%
Claim Denial Rate
The claim denial rate is a significant KPI in RCM. It estimates the number of claims that the insurance provider denies. Monies are lost if claims are denied, and appeals are denied (more on this later).
A high denial rate is risky for the revenue cycle. If costs are covered and patients are satisfied, it could impact how the healthcare institution is run.
The claims may be rejected due to coding mistakes, incorrect patient information, or improper insurance coverage. Whatever the cause, practices must monitor this measure to see any rises and deal with them.
Claim Denial Rate Formula
Track the claim denial rate through the formula below:
Claim denial rate = (Number of denied claims / Total number of claims) * 100%
Claim Appeal Rate
The claim appeal rate monitors the rejected claims that may be appealed to overturn the ruling. Even though a denied claim is unfavorable, you can still get your services paid by submitting an appeal to the insurance provider or payer. It is up to you whether you demand payment for every denied claim or just the high-value ones.
While it seems sensible to appeal each refused claim in the hopes of getting paid, doing so might slow down your workflow and add extra expenses.
Claim Appeal Rate Formula
Use the following calculation to determine your healthcare practice’s claim appeal rate:
Claim appeal rate = (Number of claims appealed / Total number of denied claims) * 100%
Bad Debt Rate
This RCM KPI calculates the proportion of receivables that are past due. The healthcare facilities cannot write off these claims in their books since they are uncollectible.
You wouldn’t want more bad debts in your practice because they represent lost revenue. A high rate indicates that the management of the hospital or clinic must work harder to secure payments or institute more stringent collection procedures.
Some defaulted loans are unavoidable. When they are identified, though, efforts should be taken to thoroughly examine how they happened and develop SOPs to prevent recurrences.
Bad Debt Rate Formula
Use the following calculation to determine your healthcare facility’s bad debt rate:
Bad debt rate = (Total write-offs / Total accounts receivable) * 100%
Net Collection Rate
The net collection rate gauges the amount of money raised relative to the total permitted amount.
A hospital or clinic receives the sum from insurance companies or other payers. Any bad debts or discounts are considered in the net collection rate. Consequently, it demonstrates to you where in the revenue cycle you are.
There will always be a difference between the gross and net collection rates. You must determine where the hospital is losing money if there is an abnormal disparity between the two.
For instance, initiatives to reduce write-offs should be adopted if one has a poor net collection rate due to many bad debts.
Net Collection Rate Formula
You can calculate the net collection rate through the below formula:
Net collection rate = (Total payments received / Total allowed amount) * 100%
Charge Lag
The charge lag identifies any charging delays that may occur after the medical treatment is rendered.
You might believe that the first 24 hours are spent documenting charges. That isn’t always the case, though. Surprisingly, just 32% of healthcare providers collect payments within 24 hours.
You must code the costs in your system quickly, even if it is typical for certain expenses to take a week before they are billed. When you get payment for your services, delays in recording costs will only be further protracted.
Charge Lag Formula
Use the below formula to calculate the charge lag:
Charge lag = Date of charges billed – Date of service
Cost to Collect
This vital parameter determines how much it costs you to get paid for your services.
Any inefficiencies costing you money can be found by tracking this metric over time. You can identify recurring costs and come up with less expensive fixes. What expenses might be incurred to collect payment for the services rendered? Employment, administration, and technology costs are just a few examples.
Cost to Collect Formula
Utilize the formula to calculate the Cost to collect:
Cost to Collect = Total costs / Total payment collected
Per-Patient Visit Revenue
This is the last KPI that records your average earnings from each patient visit.
Forecasting future sales is made simpler by tracking this KPI. You can also keep track of the revenue per patient visit for each month of the year to identify solid and bad months. In the second scenario, you can take preventative measures to avoid cash flow problems.
Per per-patient visit Revenue Formula
Use the formula below to calculate Per per-patient visit Revenue:
Revenue per patient = Total revenue generated per patient visit / Total number of patients