
Most dentists can look up what yesterday’s crown was worth. It takes about four seconds. But very few dentists can say how much that same patient will be worth to the dental practice over the next eight years.
That second number matters a great deal. It determines how much a dental practice can spend on marketing. It also shows whether the recall system is working successfully and whether opening a second location is a smart idea or an expensive one.
So why do so few dental practices know it? The reason is that dentistry is often measured one procedure at a time. A new dental patient comes in for an exam and X-rays. Later, that same patient returns for cleanings. Two years after that, the patient may need a crown. Over time, the patient may also bring a spouse and two children to the same practice.
Practice software records each of those visits as a separate event. It does not add them up into one long-term relationship. As a result, judging a dental patient by their first visit is a lot like judging a mortgage by its first payment.
The number that captures the total value of that relationship is called dental patient lifetime value, or LTV for short. Calculating it only takes one afternoon, a spreadsheet, and five figures that the dental practice already has.
What Dental Patient Lifetime Value Means
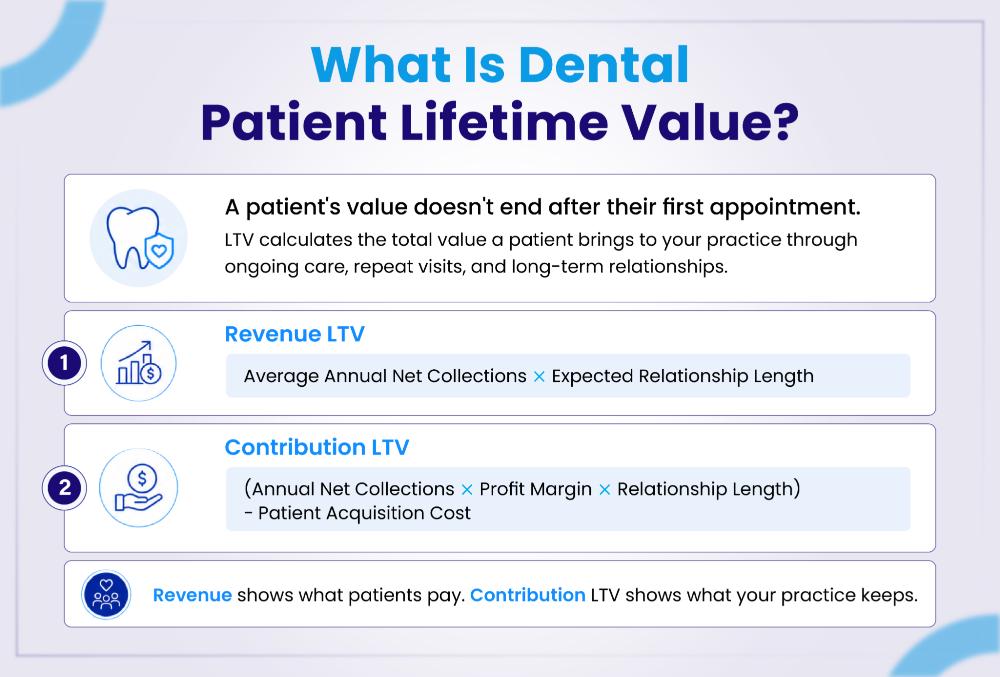
Dental patient lifetime value is an estimate. It tells a dental practice what one patient is worth over the whole time that patient stays with the practice. In other words, it measures the total value of the relationship between the patient and the dental practice, not just one visit or one year.
However, the word “value” causes a lot of confusion. It can mean two very different things. Below is an easier way to picture it.
A dental patient is not really a one-time sale. Instead, the relationship is much closer to a subscription. Throughout the period, the patient continues to return for preventive care, treatments, and other services. So, there are two ways to measure their value:
- One measures the total revenue that the patient pays the dental practice over time.
- The second number shows the profit the practice actually keeps after covering its costs.
Both numbers are useful, but only one of them belongs in a budget.
The Two Numbers Every Dental Practice Needs
Revenue LTV
Revenue LTV shows the total collections a dental practice can expect from an average patient across the whole relationship.
Revenue LTV = Average Annual Net Collections per Active Patient × Expected Relationship Length
Revenue LTV is easy to calculate, as it only requires two figures. However, it does not show a profit. Suppose one dental patient brings in $5,600 in lifetime collections. The dentist does not keep all $5,600. The hygienist, the lab, the supply company, the landlord, and the power company all take a share first. None of those costs appear in the formula above.
Contribution LTV
Contribution LTV fixes that problem. First, it applies the dental practice’s margin to those collections. After that, it subtracts the money the practice spent to win the patient in the first place.
Contribution LTV = (Annual Net Collections per Active Patient × Margin × Relationship Length) − Patient Acquisition Cost
Contribution LTV counts both the cost of treating the patient and the cost of finding the patient. For that reason, it is the only number a dental practice should compare against its marketing budget.
| Revenue LTV | Contribution LTV | |
| What it measures | Total collections from the patient | Money the practice keeps after costs |
| Counts treatment costs? | No | Yes |
| Subtracts marketing cost? | No | Yes |
| Best used for | Seeing collection volume | Marketing, budgets, growth plans |
| Risk if misused | Makes patients look far more valuable than they are | None. This is the honest number. |
THE TRAP TO AVOID
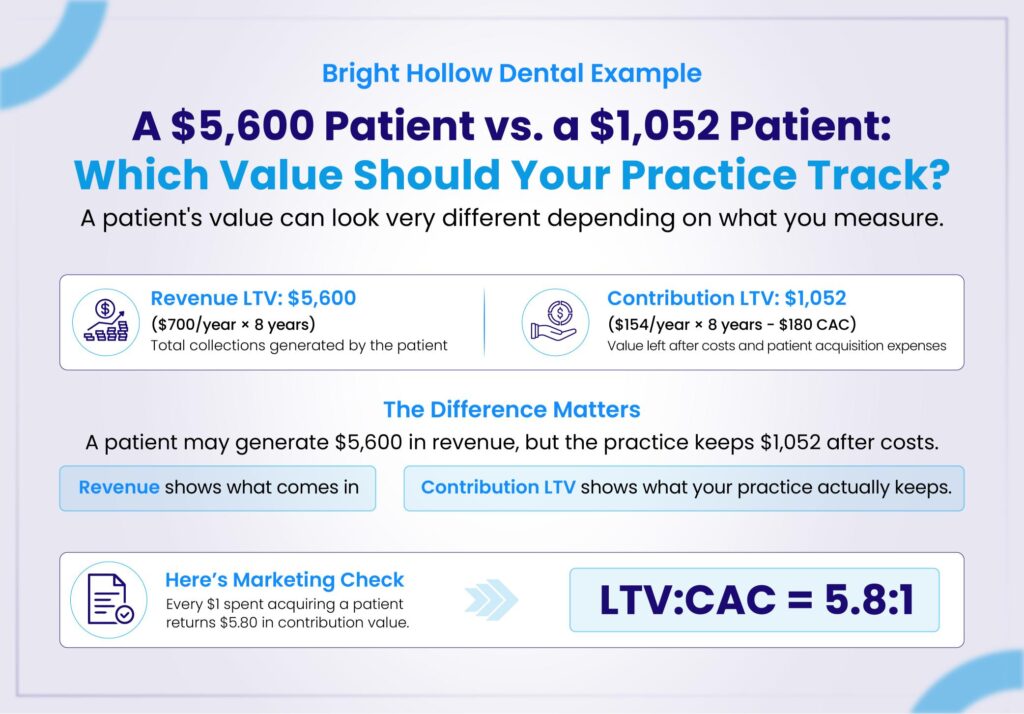
Suppose marketing costs $180 per new patient, and Revenue LTV is $5,600. On paper, that looks like a 31 times return. A number like that can get an ad budget tripled at a Tuesday morning meeting. But the number is not real. Once the cost of treating the patient comes out, the true return in the example below drops to about 5.8 to 1. That is still a healthy business. Even so, it is a very different business, and the gap is wide enough to sink a practice that budgets on the wrong figure.
Why This Number Changes How a Dental Practice Is Run
Once a dentist knows their dental practice’s LTV, several old arguments turn into simple math. Here is what the number settles.
- How much can the practice spend to win a new patient? If a patient is worth $1,052 in contribution LTV, then paying $180 to win one is a good trade. Paying $900 is not.
- Is the recall system effective? Relationship length sits inside the formula. So when patients leave after three years instead of eight, most of the lifetime value walks out with them.
- Which marketing channel is really best? Not the one that makes the phone ring most often. The best channel is the one that brings patients who stay.
- Should the practice sign that PPO contract? Run the numbers separately for PPO patients and fee-for-service patients, then compare the results to simply see which group delivers greater lifetime value.
DID YOU KNOW?
A dental practice can have strong retention, a full schedule, and happy patients, and still post a weak LTV.
Why?
Because every formula in this guide is built on collections, not production. So when claims get denied, delayed, downcoded, or simply never chased, the patient stays loyal, but the money never arrives.
Five Figures to Collect Before Starting
Every step below uses the same five inputs. All five already sit in the practice software and the year-end accounts. Pulling them takes longer than the math does.
- Annual net collections. This is the money that actually reached the bank last year, not the money that was billed.
- The active patient count. The practice also needs a written rule for what “active” means.
- Operating costs. These are the operating costs the practice chooses to include in its model.
- Retention. This is how long dental patients really stay, taken from the practice’s own records.
- New patient marketing spend. The practice also needs to know how many real patients that money produced.
How to Calculate Dental Patient Lifetime Value (Step-by-Step Guide)
To keep this easy to follow, one example dental practice runs through all seven steps. Any practice can swap in its own figures and follow the same path.
MEET THE EXAMPLE PRACTICE
Bright Hollow Dental is a single-location general dental practice. Last year, it recorded these figures:
- Annual net collections: $1,680,000
- Average active patients: 2,400
- Operating costs included in the model: $1,310,400
- Annual patient attrition: 12.5%
- New patient marketing spend: $72,000
- New patients who completed a first visit: 400
These figures are examples only. They are not benchmarks, so no dental practice should copy them.
Step 1: Choose Which Number to Calculate
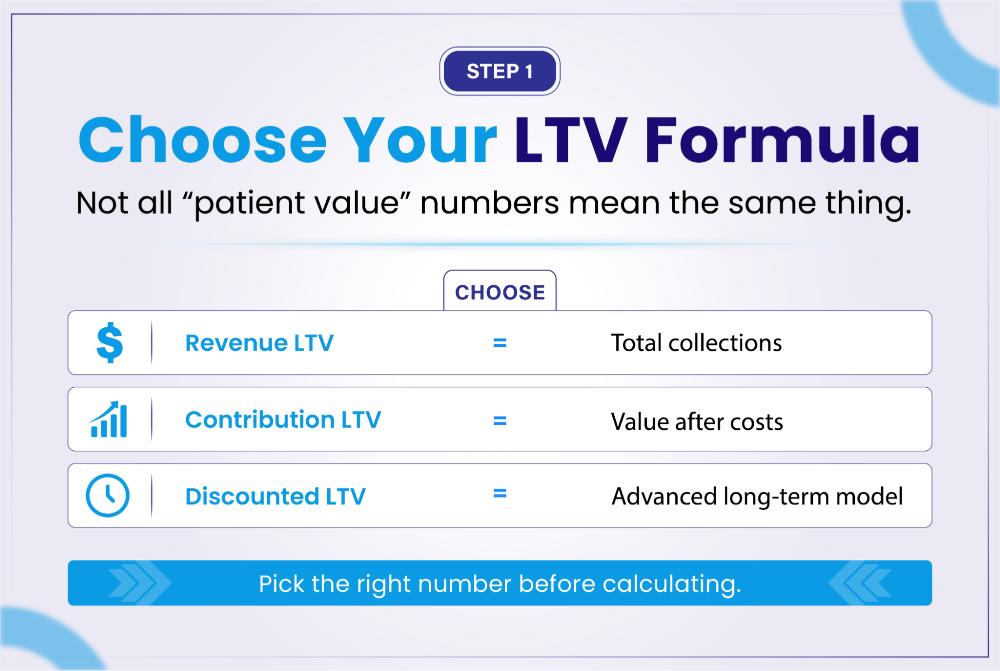
First, the dental practice must decide what it wants the calculation to measure. Three versions are in common use:
- Revenue LTV shows long-term collections.
- Contribution LTV shows the profit remaining after costs. Most dentists need this one.
- Discounted LTV is a stricter model for practices with years of clean data. It appears later in this guide.
Whichever version the practice picks, one rule always applies. Never calculate one number and then call it the other. A dental patient with $6,000 in lifetime collections does not mean the practice keeps $6,000.
Step 2: Decide What an “Active Patient” Means
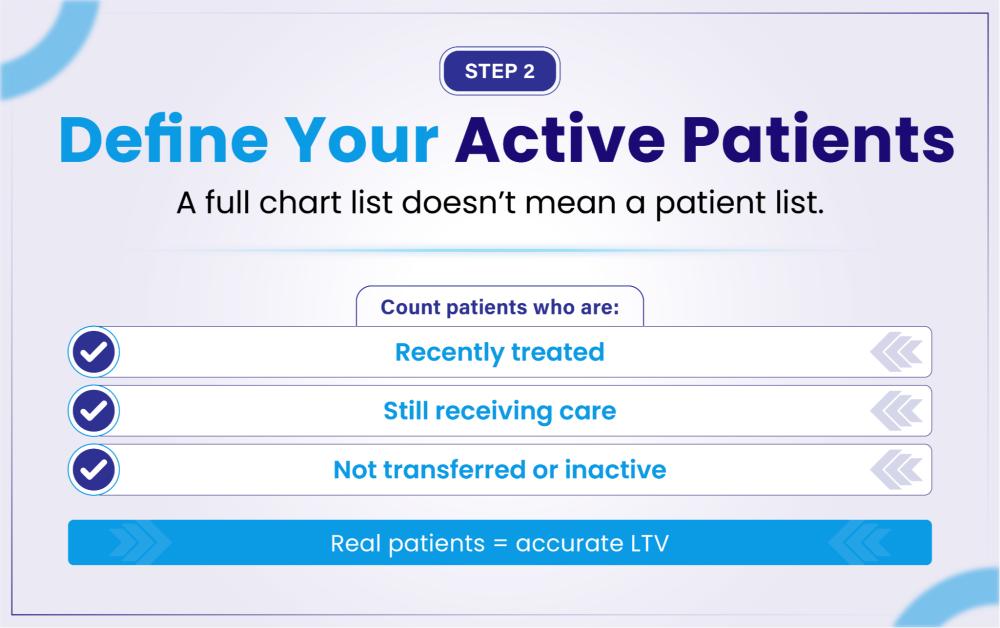
FYI: An active dental patient is someone who completed a dental service at the practice in the last 24 months, and who has not formally transferred out or ended care.
This step may sound simple, and in fact, it is. However, it is also where many practices make a mistake. That is because the patient count chosen here becomes the denominator in Step 3.
Every dental database is full of old charts. Some of those patients moved away. Some transferred to another dentist. Some came in once for an emergency in 2017 and never came back. If the dental practice counts all those charts as active patients, it divides its annual collections by a number that is far too large. As a result, the per-patient figure drops, and the whole model stops being useful.
Other time windows work just as well. For example, a practice with an 18-month recall pattern might choose 18 months. Likewise, a practice with heavy restorative work might choose 36 months. What does not work is changing the rule every quarter, simply because a new rule gives a nicer number.
A COMMON MISTAKE
“We have six thousand patients” is a sentence heard at many dental practices. Usually, it means the practice has six thousand charts. Charts and active patients are not the same thing, and only active patients belong in this calculation.
Step 3: Find Annual Net Collections per Active Patient
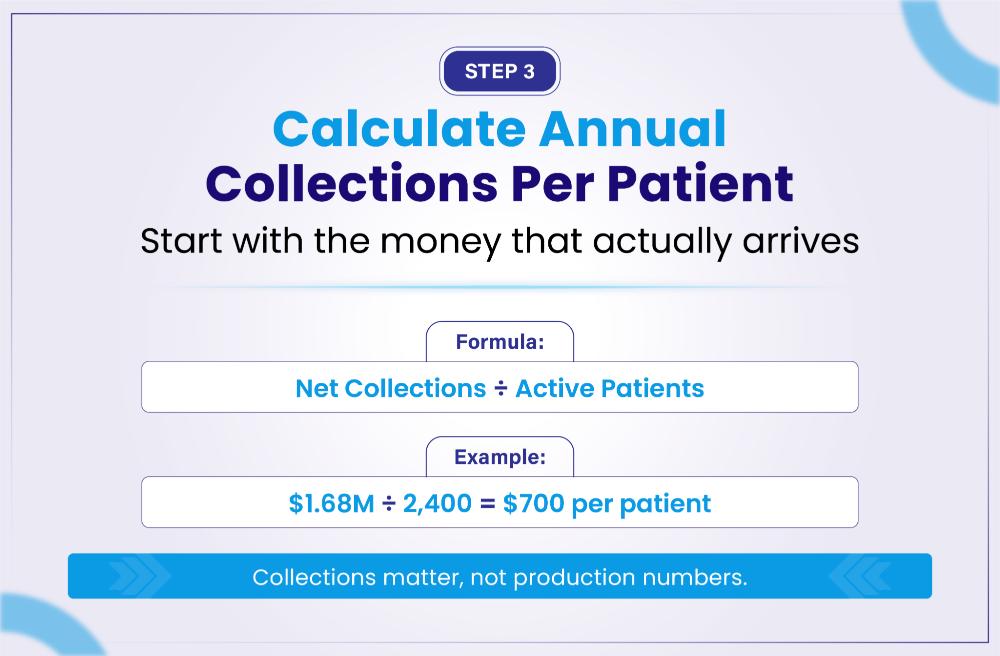
Now the dental practice can work out its first real figure.
Annual Net Collections per Active Patient = Annual Net Collections ÷ Average Active Patients
For Bright Hollow Dental, the math looks like this:
$1,680,000 ÷ 2,400 = $700
So the average active dental patient brings in $700 in net collections each year.
WHY COLLECTIONS, AND NOT PRODUCTION?
A fee schedule is not a bank account. A dental practice might charge $1,400 for a crown. Then it agrees to a $900 PPO write-down. The payer sends $600 eight weeks later. After that, the practice spends four months chasing the patient for the last $300.
Production says $1,400. Collections reflect what actually arrived. Delays, denials, contract adjustments, downcoding, and bundling all sit in that gap. So an LTV built on production is really an LTV built on money the practice never received.
One rule follows from this. Gross charges, gross production, adjusted production, and net collections are four different figures. Mixing them halfway through will ruin the result. Therefore, the practice should pick net collections, write down exactly what that includes, and then leave the rule alone.
Step 4: Work Out the Margin
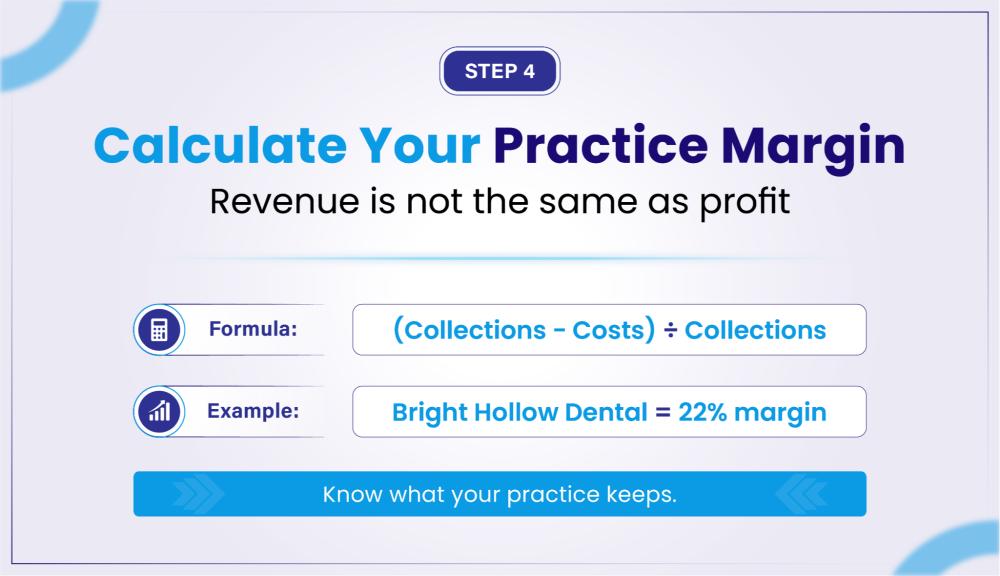
Next, the dental practice needs to know how much of those collections survive the cost of treating patients.
Margin = (Net Collections − Included Costs) ÷ Net Collections
For Bright Hollow Dental:
($1,680,000 − $1,310,400) ÷ $1,680,000 = 22%
WHICH MARGIN IS THIS, EXACTLY?
Two versions of this margin exist, and dentists often mix them up:
- Contribution margin counts only the costs that rise and fall with treatment, such as clinical labor, supplies and lab bills. So it comes out higher.
- Operating margin counts everything, including rent, admin salaries, software and insurance. So it comes out lower.
The 22% above uses the wider, all-in definition. This makes the final LTV estimate more cautious, which is the safer choice. Either version is acceptable. What is not acceptable is calling it one thing and calculating the other.
To be clear, 22% is not a national benchmark for U.S. dentistry. It is simply what came out of one example practice’s own cost rules. A different practice will land somewhere else.
Step 5: Find the Annual Contribution per Patient

Now the dental practice multiplies the two figures it already has.
Annual Contribution per Patient = Annual Net Collections per Patient × Margin
$700 × 22% = $154
Read that result carefully. The patient does not pay $154. The patient does not cost $154 either. The patient brings in $700 in collections. Of that, $154 is what the dental practice’s operating costs have been deducted.
Step 6: Find Out How Long Dental Patients Really Stay
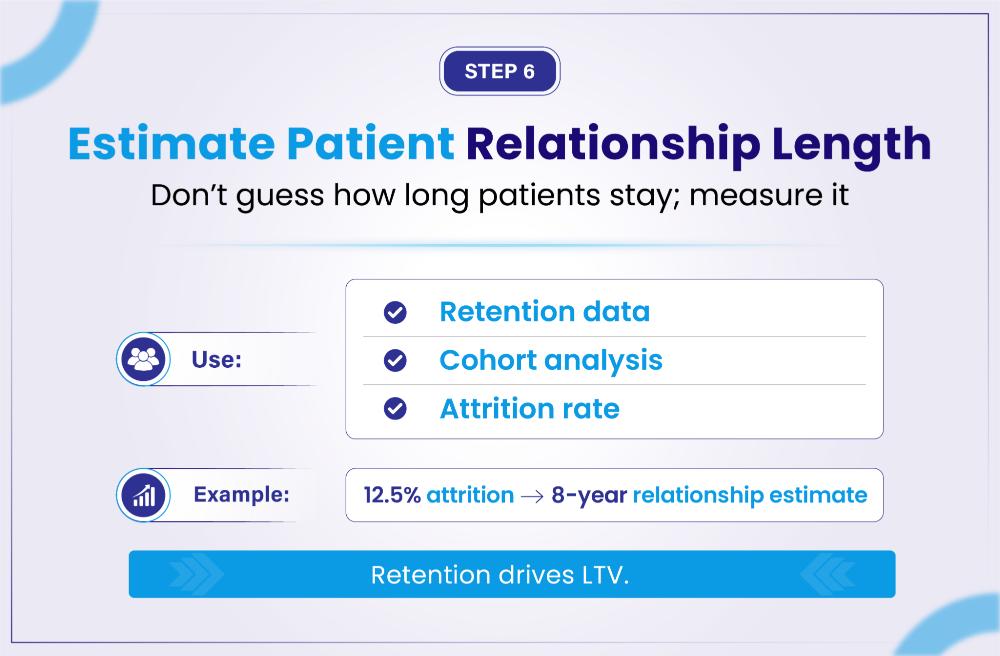
Relationship length is the biggest variable in the whole model. Unfortunately, it is also the one most likely to be estimated instead of measured . Three assumptions show up again and again in dental marketing:
- Every dental patient stays 10 years.
- Every dental patient visits twice a year.
- Every new dental patient becomes a lifelong recall patient.
All three make a spreadsheet look neat. None of them is reliably true. A dental practice that builds its calculations around these assumptions ends up with a number that looks solid and means nothing. Fortunately, there are two better methods.
Method A: Cohort Analysis
Cohort analysis is the stronger method, and it is easier than the name suggests. The dental practice groups together every new patient whose first completed visit fell in the same period. For example, everyone who joined in 2020. After that, it counts how many of those patients are still active at 12, 24, 36, 48, and 60 months.
Retention Rate = Patients Still Active ÷ Patients in Original Group × 100
Suppose 390 of the original 500 patients are still active two years later. That gives 78% retention at 24 months.
Repeating this across several groups is where the real value shows up. Patterns appear that a single average would hide completely. For instance:
- PPO patients may behave very differently from fee-for-service patients.
- One dentist may keep patients far longer than another dentist.
- Patients from one marketing channel may leave twice as fast as patients from another.
- Families may stay much longer than single patients.
Method B: The Attrition Shortcut
Some dental practices do not have cohort data yet. In that case, a rough estimate will do for now.
Annual Attrition Rate = Patients Lost in the Period ÷ Patients at Risk of Leaving
Estimated Relationship Length ≈ 1 ÷ Annual Attrition Rate
Bright Hollow loses 12.5% of its patients each year. So the math gives 1 ÷ 0.125 = 8 years.
This figure is useful, but it is only an estimate. The formula assumes attrition stays exactly the same every single year, and real dental patients do not behave that way. Therefore, a practice should treat it as a temporary estimate and drop it as soon as cohort data is ready.
Step 7: Work Out the Cost of Winning a New Patient

The last input is patient acquisition cost, usually shortened to CAC. It measures what a dental practice spends to put one real patient in the chair. A click is not a patient, nor is a submitted form. Only a completed first visit counts.
CAC = New Patient Marketing Spend ÷ New Patients Who Completed a First Visit
$72,000 ÷ 400 = $180
The dental practice should also write down what goes into that spend. Usually, it covers paid ads, agency fees, landing pages, call tracking, and direct mail.
A LEAD IS NOT A PATIENT
There is one very common way a dental practice misleads itself. It divides the ad budget by the number of enquiries, then calls the result “patient acquisition cost.” But a website form is not a patient. A phone call is not a patient. Dividing by anything except completed first visits gives a comforting number that means nothing.
The Full Worked Example (Step 1 to Step 7)
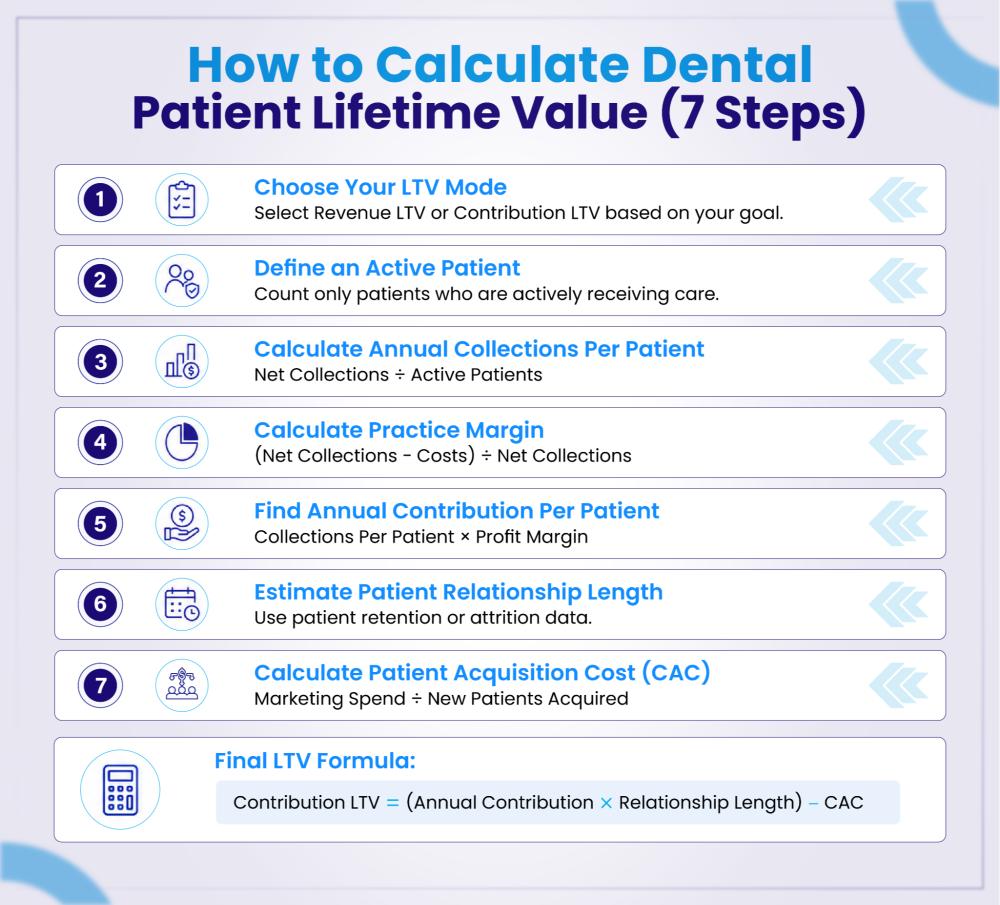
Putting all seven steps together gives the following picture for Bright Hollow Dental.
| # | Calculation | Result |
| 1 | Annual net collections per active patient ($1,680,000 ÷ 2,400) | $700 |
| 2 | Annual contribution per patient ($700 × 22%) | $154 |
| 3 | Estimated relationship length (1 ÷ 12.5%) | 8 years |
| 4 | Patient acquisition cost ($72,000 ÷ 400) | $180 |
| 5 | Revenue LTV ($700 × 8) | $5,600 |
| 6 | Contribution LTV (($154 × 8) − $180) | $1,052 |
Using the same practice, the same patients, and the same year produces two very different figures: $5,600 and $1,052. The gap is more than five to one.
That gap is exactly why calling both numbers “patient value” is dangerous. One number shows what the patient pays. The other shows what the dental practice keeps. A dentist who builds a marketing budget on the first number, while the bank account runs on the second, will overspend month after month and never understand why.
Two Ratios That Make LTV Useful
On its own, an LTV figure is just a number. Paired with the two ratios below, it starts driving real decisions.
1). The LTV to CAC Ratio
This ratio answers a question every dentist has asked at least once. How many dollars come back for every dollar spent on marketing?
$1,052 ÷ $180 = 5.8 : 1
Bright Hollow earns about $5.80 in contributions for every $1 it spends to win a patient. That is a healthy business by any standard.
Notice what happens if the wrong number is used. Revenue LTV would make the same practice look like 31 to 1. The owner might then triple the ad budget for no good reason.
On the other hand, a ratio below 1 to 1 means the practice pays more for patients than they are worth. That is not a small marketing fix. It is a serious financial warning.
2). The Payback Period
The second ratio asks how long a new patient takes to repay the cost of winning them.
$180 ÷ $154 per year ≈ 1.2 years (about 14 months)
This is a cash flow question, not a profit question. A 14-month payback means the dental practice can fund its own growth without strain. A four-year payback may still look profitable at first glance, yet it can leave the practice short of cash. That is how practices with good margins end up struggling to make payroll.
A More Advanced Model: Discounted LTV
Everything above assumes two things that are not quite true. First, a dental patient contributes the same amount every year. Second, that $154 received in year eight is worth the same as $154 received today.
In reality, patients drop away slowly rather than all at once. Money received in the future is also worth less than money today. A dental group or DSO with several years of patient data can model both effects properly.
LTV = Σ (t = 1 to T) [ (Contribution in Year t × Probability Active in Year t) ÷ (1 + Discount Rate)^t ] − CAC
Here is what each part of that formula means:
- Σ (sigma) simply means “add up every year.”
- t is one year of the relationship. T is the last year in the model.
- Contribution in Year t is what the patient is expected to contribute that year.
- Probability Active in Year t is the chance the patient is still with the practice.
- Discount Rate turns future dollars into today’s dollars.
- CAC is subtracted once, right at the end.
Running that over five years for Bright Hollow, with an 87.5% annual retention rate and an 8% discount rate, gives this:
| Year | Still active | Discount factor | Present value of contribution |
| 1 | 100% | 0.926 | $143 |
| 2 | 87.5% | 0.857 | $116 |
| 3 | 76.6% | 0.794 | $94 |
| 4 | 67.0% | 0.735 | $76 |
| 5 | 58.6% | 0.681 | $61 |
| Total | $489 |
$489 − $180 CAC = $309 discounted contribution LTV over five years
That result is far more cautious than the $1,052 the simple model produced. Neither figure is wrong because they answer slightly different questions over different time frames. Still, the contrast proves an important point. Comparing one practice’s LTV against another practice’s LTV means very little unless both sides explain how the number was built.
DOES A PRACTICE NEED THIS MODEL?
Probably not right away. A dentist calculating LTV for the first time is far better served by the simple model in Steps 1 to 7. The discounted version becomes worth the effort later, once three or more years of clean cohort data exist and a real decision depends on the extra precision.
Is There an Average Lifetime Value for a Dental Patient in the USA?
The honest answer is no. There is no national figure that a dental practice should trust.
Search online, and the numbers range from a few thousand dollars to well over ten thousand. Each one sounds confident. They cannot all be right, and the reason has almost nothing to do with dentistry. Instead, the methods behind them differ:
- One source used production. Another used collections.
- One subtracted acquisition cost. Another did not.
- One assumed a flat 10-year relationship. Another used real retention data.
- One quietly added referral revenue to the total.
Change the method, and the answer changes with it. In fact, the worked example above shifted by a factor of five inside a single practice.
The practices themselves are not comparable either. A PPO-heavy general practice, a fee-for-service restorative office, an implant clinic, a pediatric practice, an orthodontic office, and a multi-site DSO all differ from one another. They differ in payer mix, treatment mix, retention, acquisition cost, and collections. Expecting one LTV figure to describe all six is like expecting them to share one overhead percentage.
WHAT TO DO INSTEAD?
Published figures work well as background. They work badly as a replacement for a practice’s own data. So when someone shares a confident national number, the right question is simple: what is inside it? Production or collections? Was a margin applied? Was CAC subtracted? Are referrals included? How many years does the calculation cover? A confident number with a weak method behind it is still a weak number.
How a Dental Practice Can Improve LTV, Ethically
Before talking about the ways to increase patient lifetime value (LTV), one rule must come first. Raising LTV never means recommending dentistry a patient does not need. It must never mean bringing a patient back more often than their clinical situation calls for.
The ADA’s principle of beneficence asks a dentist to act in the patient’s best interest, based on that patient’s needs, values and clinical situation. LTV is only a business metric. It does not get a vote in the treatment plan.
With that settled, here are the levers that genuinely move the number.
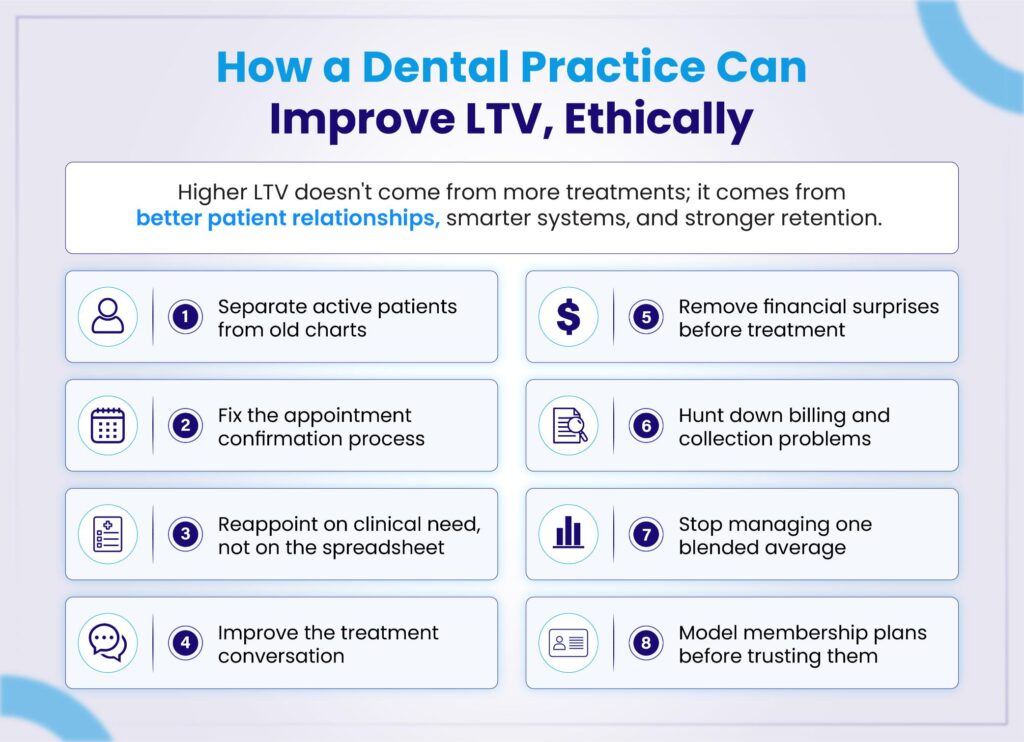
1). Separate active patients from old charts
The practice should track active patients, new patients, reactivated patients, transferred patients, end-care patients, and lapsed patients as separate groups. This is the least exciting item on the list, and probably the most valuable, because every other calculation depends on it. A large chart count is not a retention strategy.
2). Fix the appointment confirmation process
A dental relationship cannot build long-term value if appointments keep vanishing from the schedule. So confirmations should go out through the channel each patient actually prefers, whether that is text, email, or phone. The practice should record that preference and follow privacy and communication rules.
After that, the practice should measure what happened, not just what was booked. Useful figures include:
- Scheduled, confirmed and completed appointments
- Same-day cancellations and late cancellations
- No-shows
- Successful reschedules
These should be broken down by dentist and by appointment type. Otherwise, one practice-wide percentage will hide the exact place where the problem sits.
3). Reappoint on clinical need, not on the spreadsheet
If a model assumes two visits a year for everyone, the model is wrong. The answer is to fix the model, not to push patients into it. Real appointment data and clinically suitable intervals should drive the schedule instead.
4). Improve the treatment conversation
Patient retention is rarely just a front-desk problem, even though the front desk usually gets the blame. In many cases, patients often leave for other reasons. The next step was never made clear. The options were explained too quickly. The money talk was rushed into the same five minutes as the clinical talk. Or nobody followed up after a complex procedure.
A dental practice can check itself against a few honest questions:
- Do patients leave knowing exactly what happens next?
- Are treatment options explained before cost enters the room?
- Are clinical recommendations kept separate from money discussions?
- Are patient questions written down and answered?
- Does anyone follow up after complex treatment?
- Does the patient know who to call when something goes wrong?
The aim is not a sales script. The aim is to close the gaps where a good dental relationship quietly falls apart.
5). Remove financial surprises before treatment
Nothing damages trust faster than an unexpected bill. So before treatment starts, the patient should understand the network status, the expected insurance contribution, the deductible, the coinsurance, any non-covered services, the likely patient portion, and when payment is due. The patient should also know that an estimate is only an estimate until the payer processes the claim. Financial clarity is not separate from retention. It is an important part of it.
6). Hunt down billing and collection problems
A dental practice can still lose economic value due to poor revenue capture, even if the dental patient relationship is loyal.
As per the ADA, denied or delayed payments, or any contractual issue regarding dental benefits can impact dental-office revenue.
This translates to the following audit needs to optimize the LTV:
- Documentation
- Eligibility and benefit workflows
- Claim submission accuracy
- Current CDT coding
- Required attachments
- Denial follow-up
- Payer adjustments
- Patient balance workflows
- Handling refunds and recoupments
7). Stop managing one blended average
A single practice-wide LTV hides more than it reveals. Instead, the practice should calculate LTV separately for PPO patients, fee-for-service patients, membership-plan patients, pediatric patients, and periodontal maintenance patients. It can also split the figure by location, dentist, marketing channel, and first-visit type.
This is not about deciding that some patients matter more than others. It is about finding where the financial performance differs, so the practice fixes the right problem.
8). Model membership plans before trusting them
An in-office membership plan can support longer dental relationships, especially for patients who do not fit normal insurance arrangements. However, it does not raise LTV automatically. The practice should model it first, covering pricing, state rules, included services, realistic usage, admin cost, renewal rate, and patient mix. The plan has to work for the practice, not just on the vendor’s slide deck.
Where Lifetime Value Quietly Leaks: The Billing Side
A dental patient can love the dentist, attend every recall visit, and accept every treatment plan, and still deliver far less value than expected. Nothing went wrong clinically. The money simply never fully arrived.
Remember that every formula in this guide is built on collections. Therefore, anything that sits between the treatment and the bank deposit is quietly eating lifetime value. The common causes are worth checking one by one:
- Eligibility and benefits that were never properly verified
- Claims submitted with errors
- CDT coding that has fallen out of date
- Missing x-rays, perio charting or other required attachments
- Denials that nobody followed up
- Downcoding and bundling accepted without a challenge
- Payer adjustments taken at face value
- Patient balances that were never worked
- Recoupments and refunds handled inconsistently
THE DIAGNOSTIC QUESTION
When LTV comes out lower than it should, one question deserves to be asked before marketing takes the blame: did the patient leave, or did the money?
Very often, the patient stayed. The claim was denied. The balance was never worked on. The attachment was missed. The denial sat in a queue for ninety days. None of those are retention failures. They are billing failures, and they are usually far cheaper to fix than buying a fresh batch of new patients.
Seven Mistakes That Ruin the Calculation
❌ Mistake 1: Counting every old chart as an active patient. This inflates the denominator and crushes every per-patient figure. So the definition has to come first, and the math second.
❌ Mistake 2: Treating production as cash. A fee typed into the software is not money in the bank. Adjustments, denials, delays, and unpaid patient balances all sit in between.
❌ Mistake 3: Assuming every patient stays the same number of years. They do not. In fact, the gap between segments is often larger than the average itself. Use cohorts wherever the data allows.
❌ Mistake 4: Assuming every patient visits twice a year. Forcing real behaviour into a tidy revenue model does not make the model more accurate. It only makes it more confident.
❌ Mistake 5: Counting leads as acquired patients. A form is not a patient. A phone call is not a patient. Only a completed first visit counts as one.
❌ Mistake 6: Adding referral value into direct LTV. Referrals do matter. However, referred patients carry different acquisition costs, payer mixes, and retention patterns. Measured separately, they are useful. Blended in without a label, they make the practice’s own numbers impossible to compare, even against last year.
❌ Mistake 7: Copying a benchmark from the internet. Published dental LTV figures vary widely because the methods behind them vary widely. They are in the background. They are not a substitute for a practice’s own data.
Metrics to Track Alongside LTV
LTV works best when a practice tracks it alongside other numbers. On its own, it can only warn that something is wrong. Alongside the figures below, it also points to the cause.
- Annual net collections per active patient
- New patient acquisition cost
- Cohort retention at 12, 24 and 36 months
- Inactive patient count and reactivation rate
- Completed appointment rate, no-show rate and cancellation rate
- Treatment plan acceptance and completion
- Collection performance by payer segment
- LTV to CAC ratio and payback period
Read together, these figures usually reveal the real problem. It may be acquisition, retention, treatment completion, collections, or cost. That is far more useful than a single number that simply came out lower than expected.
Frequently Asked Questions
What is the lifetime value of a dental patient?
It is an estimate of the money a dental practice can expect from one patient over the time period of the whole relationship. The exact figure depends on what the practice chooses to include in the model. That is why two practices can both calculate LTV correctly and still get very different answers.
What is the formula for dental patient LTV?
There are two formulas, and both are worth having.
Revenue LTV = Annual Net Collections per Active Patient × Relationship Years
Contribution LTV = (Annual Net Collections per Active Patient × Margin × Relationship Years) − CAC
Should a dental practice use production or collections?
Collections should be used when calculating LTV. Production records what the practice charged. Collections record what actually arrived. In dentistry, delays, denials, contract adjustments, and unpaid balances sit between the two. As a result, production will always make LTV look bigger than it really is.
How often should a dental practice recalculate LTV?
A full calculation should be performed at least once a year. The key inputs deserve closer attention than that. A practice whose payer mix, fees, marketing spend, locations, or collections are changing quickly should review the numbers every quarter.
Can dental patient LTV be negative?
Yes, denial patient LTV can be negative. Under the contribution model, LTV turns negative when the expected contribution is smaller than the acquisition cost. Suppose a practice spends $900 to win a patient who contributes $154 a year and leaves after three years. The practice lost money on that relationship, and the model will say so plainly.
This result says something about the practice’s marketing and nothing about the patient. It is a signal to fix the marketing channel. It is never a reason to treat a patient differently.
Should referrals be counted in LTV?
Referrals should be measured and reported separately. Mixing referral value into direct patient LTV produces a figure that cannot be compared with anything, including the same practice’s figure from last year.
Is a higher LTV always better?
Not necessarily. A higher figure may reflect better retention, stronger collections, lower acquisition costs, or leaner operations, which is genuinely good news. Equally, it may reflect an optimistic relationship length, production counted as collections, dead charts counted as active patients, referral value added without a label, or acquisition cost that was never subtracted. A bigger number is only worth having when the method behind it is honest.
Does a dental practice need special software?
No. The practice management reports, the profit and loss statement, and a spreadsheet are enough. The math was never the hard part. The hard part is defining an active patient, pulling clean collections data, and using the same definitions consistently long enough to compare one year with the next.
The Bottom Line
A dental practice’s lifetime value should describe the reality of its own business. Not a national average, or a number pulled from a marketing article.
To calculate an accurate LTV, the medical practice requires five key inputs:
- A written definition of an active dental patient
- Actual net collections
- A clearly defined margin
- Retention taken from the practice’s own records
- A real patient acquisition cost
With those five in hand, the practice can run both formulas.
Revenue LTV = Annual Net Collections per Active Patient × Relationship Years
Contribution LTV = (Annual Net Collections per Active Patient × Margin × Relationship Years) − CAC
Of the two, the second one changes decisions; the contribution-based LTV is generally the more valuable business metric, as it looks beyond revenue and shows how much value a patient actually brings after profit margins and the cost of acquiring new patients. Patient acquisition cost (CAC) at the end is not an optional adjustment. Marketing is a real cost of owning that patient relationship. A model that leaves it out will push the practice into spending money it will never earn back.
With both numbers in hand, a dentist can finally test marketing spend, retention, billing performance, and collections against something real.
Above all, when the results disappoint, ask yourself the question. Did the patient leave, or did the revenue? Very often, the patient stayed, but the claim may have been denied, an outstanding balance may have gone unpaid, required documentation may have been missed, or a payer adjustment may have been accepted without a second look.